How should drug interaction warning screens look?

Most clinicians I know suffer from "alert fatigue". I don't mean they feel tired from too much caffeine.

I mean, they are tired of EHR software crying wolf with too many drug interaction warnings. Embattled users simply dismiss all drug interaction warnings without reading them. Mild or theoretical interactions should be suppressable by individual user preference, as a default setting.

This is a significant patient safety issue.

If I am relying on my software to warn me about serious drug interactions, then the warnings about milder or dubious interactions are annoying, distracting false alarms. I need to be aware of serious interactions, so I can adjust therapy.

Here's another problem: I get warned that drug A interacts with drug B. I dismiss the warning. Then I immediately get warned that drug B interacts with drug A. I know that!

Worse yet, if I then change the dose of drug A, I get warned all over again. We need smarter systems now, geared to what fallable, imperfect, tired human users need, and geared to keeping patients safe.

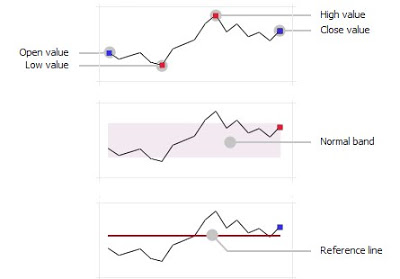
Here is a modest proposal of a way to display drug interactions.

Drug-Drug_interaction_alert_sketch.jpg

Note that the key findings are in the middle, the drug names are prominent, the severity level is great big number, and user pref settings are right there.

Posted by Picasa

Using tiny graphics to show a year's worth of medication history

Here are two views of the medication list.

The top view has more details, needed when the clinician is doing refills or dosage adjustments.

The bottom view is more terse, suitable for a dashboard view. The dashboard view would commonly include the problem list, allergies, vital signs, lab, and health maintenance information.

If I have a list of medications to look at, how can I quickly see the temporal dose trend without drilling into the EMR? How can we keep the history information on one visual surface?

Here's an idea below.
I have not seen it implemented in any EMR yet. Have you?

The Four-Layer EMR

We are being freed from the document-centric mental model of the medical record. In the paper past, we only could create, save, read, and review paper documents. That has changed, but our way of thinking has not.

As with data tables that allow us to sort, or links that allow us to drill down, our clinical documents have interactive features. Or should have.

So let me propose a model for the Four-Layer EMR. It would use some kind of "hide/reveal" technology. Show me the level of detail I, the reader, need right now, in this context.

The top layer I call the "one-line summary". What few words characterize this encounter. I am thinking of ambulatory physician visits. Perhaps other readers can translate this into other kinds of clinical encounters.

The one-line summary would be a terse description like: "diabetes, A1C 8.2, start metformin 500 BID" or "acute sinusitis > amoxicillin 875 BID 7 days" or "well woman exam > Gardisil, Yasmin".

The benefit? I can look at a list of all the visits chronologically and see what happened.

Like this:

Brenda Star          Acct No: 309144869
02/11/07                acute sinusitis > amoxicillin 875 BID 7 days
04/29/07              well woman exam > Gardisil, Yasmin
09/02/07              diabetes, A1C 8.2, start metformin 500 BID

The next layer down, the "Executive Summary", is what I would communicate to a surgery consultant. It is a 3-4 sentence description of this encounter in a depth adequate for a consultant or other peer not needing a complete picture of this patient.

For example, it might say "57 year old type 2 diabetic recently started on metformin with good control, needing evaluation of chronic cough, not on an ACE inhibitor".

Next, the 3rd layer, the "Working Layer" is the layer clinicians would like to work in for the details they need. That is, before we started documenting to cover our assess.

It would include only the pertinent history elements necessary to understand the diagnosis and treatment. In the Review of Systems, it would only include the positive elements, with a few negatives (e.g. "no murmur" if that is pertinent to note).

In the Assessment and Plan, only the parts that are not assumed. I do need to know which antibiotic was used. I don't need to read that the patient was told to take tylenol and come back if they don't get better as expected.

The fourth layer would make my attorney, my risk-manager, and my chart reviewers happy. All the wealth of detail is there that would only annoy the rest of us. All the detail that makes my record look more like a contract, and less like a story about a person.

Parenthetically, there are layers deeper than these four. These layers include the security/audit trails that record who recorded what and when. We'll ignore them for our purposes here.

So, how do we bring this concept about?

  1. Identify the elements that define each layer.
  2. Choose a technology that supports it in your particular product.
  3. Work out the details that specify the contents of each layer within a specific document. Could the software identify key words for Layer 1 (One-line summary) in context? Would the provider need to supply these in the beginning or end of document production?

Your thoughts?

If God wanted us to type, She wouldn’t have given us transcription

Dictating is just faster than typing! Period!

If EMRs are to successfully roll out to all physicians, physician information entry has to be faster than dictating. Only the technologically eager (like me) or the coerced (like my partners who bought the product) will spend more time doing medical record-keeping than they did before EMR implementation. Those physicians who have a choice will still dictate.

Of course, medication and diagnosis lists are the exception, once they are established. But these elements can arguably be quite time-consuming.

Wise EMR products put a little "dictate here" icon at various points in the EMR to capture a voice file, for those times when a story must be told.

Dashboards from Sparklines: All Systems Go!

Dashboards will have several uses in the EMR environment.

  • ICUs for displaying those 3-page wide flowsheets of clinical data: intake, output, vital signs, lab, drips, PCA.
  • Chronic disease overviews: lab, home monitoring results, vital signs, prompts for next lab or immunization
  • Quality Improvement: compliance with standards, progress toward targets, peer comparisons
  • Pay for Performance: Budget, progress toward targets, return on investment
  • Management dashboards: trends, year-to-year comparisons, key performance indicators

Here are some nice examples

Traffic light (colored dots of red) in the second column. Sparklines in the third column. Bullet graphs in the rightmost columns.

Microbar graphs on the lowest row, with sparklines just above them.

After you sketch out a new dashboard with pencil and paper, you may want to dress it up to show off before you start spending engineer time on it.

Here is a nice PowerPoint template for making high-fidelity wireframe mock-ups.
Download Dashboard Template

Sparklines: Coming to an EMR near you

Sparklines are data-intense, word-sized graphics designed to be incorporated into text. Used in an EMR, we can see the recent lab value and its associated trend over time.

Edward Tufte pioneered the concept of sparklines, and his website has a large collection of resources to those who want to explore sparklines further.

We should be using sparklines throughout our EMRs.

  • As elements of clinical dashboards
  • Monitoring chronic disease processes (lipids, A1C, renal function for diabetes)
  • Monitoring vital sign and physiologic parameters in ICU patients
  • Managing improvement trends in CQI processes
  • Tracking financial performance in management dashboards

Where can I find code to implement sparklines?
Visit this site for links to non-commercial in several programming environments, including PHP, Javascript, C#, Lisp, Perl, Python, Ruby, Java, Excel VBA.

Commercial Implementations of sparklines include software add-ons for Excel:
BissantzSparkMaker
MicroCharts
Business Refinery SimpleCharts

This graphic from MicroCharts gives detail on how we can show "normal range" or "target range" with a gray band, or a threshold value with a red line.

Developers! Start your engines!

Clinicians! All you need is pencil and paper to start sketching the dashboards, lab displays, and other graphs you need. Then share those with your EMR vendor.
Let's start seeing these word-sized, data intense graphics in all our EMR visual displays.

What are we aiming for?


In the world of making EMR's more helpful to clinician users, how high should we aim?

It's tempting for EMR vendors to try to impress with a long list of features. But that doesn't make me an Efficient user. It certainly doesn't sustain Enchantment after the sales demo, once I'm using the product.

I saw this nice illustration of the User Hierarchy of Needs at a blog called Creating Passionate Users.

I think we are around 2nd or 3rd stage for most EMR's. We might see pockets of Learnability or Efficiency in our own EMR. The most progress has been made in areas like managing medications and remembering diagnoses.

How would you rank your own EMR on the whole? Send your comments. Spread the word.

Some Assembly Required


Make the EMR software work right out of the box.

I do expect my local organization to build lists of my favorite medications, diagnoses, pharmacies, consulting and referring physicians, etc.

I shouldn’t have to be making templates for common problems. That’s what programmers do.

If I can't create a template or a reusable note as easily as word-processing document, then there is a problem with the EMR product. I should not have to hire someone with IT training to make the software usable or efficient.

Blogging software has made it easy for the rest of us to make a dynamic website with no knowledge of HTML. Now let's bring that ease of use to the EMR.